It all started a few months ago when one of my colleagues asked me how I managed to get involved in so many topics. He was convinced that I worked 12 hours a day, weekends included.
For my part, I was rather puzzled: I felt I was keeping a fairly reasonable work pace. Telling him that I worked neither evenings nor weekends didn’t really help him understand how I worked. Our debate sorely lacked facts.
So I set myself a challenge:
Track my professional activities in detail for 4 weeks
Step 1: Categorize the activities
Before I could track my activities in an Excel file, I had to categorize them.
- Are running a workshop and presenting a deliverable to a client similar activities?
- Are recruiting a future employee and a one-on-one meeting with one of your current team members similar activities?
After (very) many back-and-forths, I came up with 10 categories that cover 100% of my professional activities:
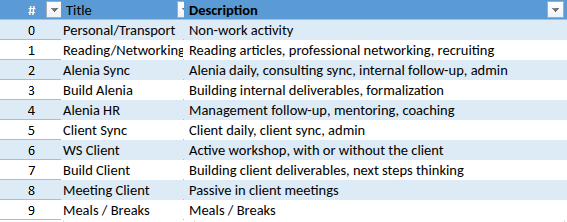
This list of activities is obviously very personal, and depends heavily on my job (consultant) and on the things I want to see show up.
Step 2: Give each activity a weight
Listing the activities isn’t enough: some are more important than others and/or bring more value to my work than others.
To make the analysis easier, I distinguished activities with a high cognitive load (running a workshop) from activities with a low cognitive load (internal syncing), or even counterproductive ones (being passive in a meeting).
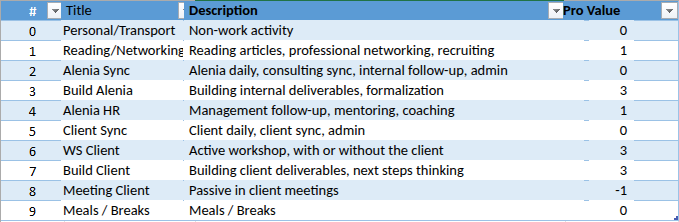
Once again, this weighting (=Pro Value) is entirely personal. Depending on the activities you want to highlight or the activities you want to cut down on, the weighting has to be adapted.
In my case, I mostly wanted to increase the time spent building deliverables, internally and with my clients, hence the score of 3.
Step 3: Add other lines of analysis
Tracking your activities for 4 weeks is no small thing, so you might as well add other lines of analysis to answer other questions.
For example:
- Do I work more at my company’s offices or at home?
- Where am I most efficient, with higher value-added tasks?
- How does my fatigue level vary over the week? depending on my activities of the day?
- And my satisfaction level? am I more satisfied when I work more? when I’m more productive? when I have more interactions with my colleagues?
On top of filling in my activities every 15 min, I therefore decided to add information on my place of work, my satisfaction and my energy level at the end of each day, to detect potential correlations.
Step 4: Build an input file
This is the most time-consuming step of all, so here is a template that will save you some time!
The file is shared on Google Sheets, but it is read-only. Feel free to make a copy to fill it in on your side. The file is built to be as configurable as possible, with a tutorial in the first tab.
Your feedback on bugs or improvements is welcome!
Step 5: Fill in the file in 15-min slots
First of all, why 15 min? why not go up to 1 hour to limit the number of entries?
Indeed, for a 10-hour day, that makes 40 different entries, which can seem like a lot. The main reason for choosing 15-min slots is to allow a certain level of detail in the data collected. Using one-hour ranges wouldn’t show the coffee breaks or the office chats with colleagues, and would therefore give an overly smoothed view of reality.
But there is no need to open and fill in the file every 15 mins!
In practice, I only filled in the file every hour or every two hours, detailing my activities. In reality, some activities last less than 15 min. And you quickly notice that the categories aren’t “pure”. During a 1-hour meeting, it’s not unusual to “waste” your time for 15 min, but then participate actively for the following 45 min because the topic interests you. Or, during a 15-min slot, to read an article on LinkedIn, answer an email, and grab a coffee.
In any case, I set myself the rule of being as transparent and honest as possible. I wanted to track my working time as well as the length of my breaks, but above all the quality of how I used my time.
And here is the result:
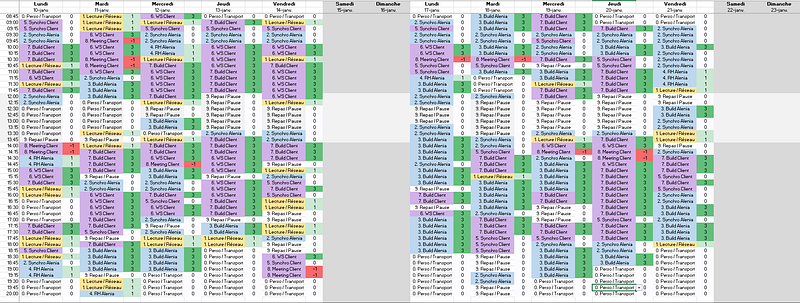
Even zooming in, and with the color coding, you can’t make much of it. Now it’s time to analyze the results.
Step 6: Analyze the results
After 4 weeks of filling in my activities every 15 min, we were finally able to answer all the questions we had been asking ourselves.
Over the period in question:
- I worked an average of 8 hrs 25 min a day (excluding coffee breaks, lunches, and commuting…). As an executive and manager in a consulting firm, that was rather reasonable. It meant I never started my days before 8:30 am, and only very rarely finished after 7:30 pm.
- Out of those 8 hrs 25 min, an average of 50 min is dedicated to my personal development, to my learning. We were quite surprised by the result, because it doesn’t include reading books in the evening, for example.
- I spend very little time in meetings where I’m not directly productive and active: over the 4 weeks, I only logged 3 hrs 30 min, i.e. less than an hour a week.
- When working from home, I work an average of 30 min more, but the split of my time between my client, my firm and my personal development stays the same. I also spend 30 min more at my maximum productivity level. I feel I have more energy at the end of the day (+0.2 pt) but I lose some satisfaction (-0.5 pt)…
- When working from home, I regularly take breaks of more than 1 hour, outside of lunch, to do something else (sports, groceries…). But no notable effect can be seen on my total working time, nor on my productivity.
- I spend an average of 4 hrs 30 min a day at my productivity peak, with a maximum of 6 hrs 15 min. My most productive days are Tuesday and Thursday, and my efficiency clearly drops on Friday. My satisfaction level at the end of the day is directly correlated with the time I spend at maximum productivity. As for fatigue, there is no obvious correlation, but that is certainly due to external factors (kids?).
- My productivity clearly follows a wear-out effect: the further I get into the day, the less productive I am, which creates a “plateau” effect. Beyond 5 hrs 30 min at maximum productivity, I clearly lose efficiency and burn through energy. Here is how my productivity evolves over a typical day:
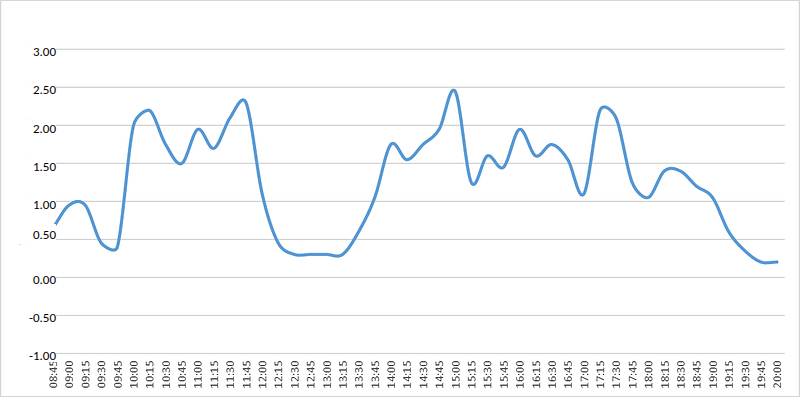
All these analyses can be done directly with the shared template.
Step 7: Wrap up and go further
Tracking my activities for 4 weeks taught me a lot about the way I operate. After all these analyses, I know myself better and I plan my days more carefully. When working from home, I also have fewer qualms about taking a 1-hour break in the middle of the day, because I now have proof that it doesn’t hurt my work.
I also now have a good argument to take to my management: with 4 hrs 30 min a day at maximum productivity, I meet almost 100% of my professional objectives.
It’s high time I asked to go part-time at the same salary!